

moonchart
A statistical chart SVG generation library for MoonBit. Supports bar charts, line charts, scatter plots with error bars and multi-series rendering.
chart
plot
svg
visualization
statistics
science
moon add JunJunTnT/moonchart@0.1.2
Download zipAuthor
Version
0.1.2
License
Apache-2.0
Repository
Last updated
last month
Downloads
29
Dependencies
- moonbitlang/x0.4.44
- JunJunTnT/moonchart0.1.1
 README
#MoonChart
MoonChart is an SVG charting library written in MoonBit. It produces vector graphics suitable for scientific and statistical plotting — bar charts, line charts, scatter plots, and box plots — with error bars, multi-series rendering, and extensive style controls. Output is an SVG string that can be saved to a file or rendered in a browser via WASM.
Package: JunJunTnT/moonchart
Repository: https://github.com/JunJunTnT/moonchart
License: Apache-2.0
#Installation
moon add JunJunTnT/moonchartThen import it in your MoonBit source:
import "JunJunTnT/moonchart"#Simple Demo
#Performance
MoonChart delivers sub-millisecond SVG rendering via WASM — 500x faster than matplotlib and 20x faster than ECharts on the same input→SVG pipeline.
| Library | Mean Render Time | Speedup (vs matplotlib) |
|---|---|---|
| MoonChart | 98.3 μs | 501× |
| ECharts | 1.97 ms | 25× |
| matplotlib | 49.2 ms | 1× |
#Quick Start
A minimal bar chart with error bars:
fn main {
  let data = [
    DataPoint::withErrY(0.0, 45.0, 3.0),
    DataPoint::withErrY(1.0, 62.0, 2.5),
  ]

  let result = Chart::new()
    .title("Cell Viability")
    .xTicks([0.0, 1.0], ["Control", "Treated"])
    .xLabel("Condition")
    .yLabel("Viability (%)")
    .yRange(0.0, 100.0)
    .series(Series::bar("24h", data))
    .toSvg()

  match result {
    Ok(svg) => println(svg)
    Err(e) => println("Error: \{e}")
  }
}#Chart Types
#Bar Chart
Rectangular bars with optional error bars, grouped or stacked positioning, and bar stroke styling.
let data = [
  DataPoint::withErrY(0.0, 45.0, 3.0),
  DataPoint::withErrY(1.0, 62.0, 2.5),
]

Series::bar("Group A", data)
  .withColor(Color::rgb(0, 122, 184))
.withBarStroke(Color::rgb(0, 80, 140), 1.0)#Line Chart
Connected points with configurable dash styles, point shapes, and point fill colors.
let data = [
  DataPoint::new(0.0, 100.0),
  DataPoint::new(1.0, 85.0),
  DataPoint::new(2.0, 72.0),
]

Series::line("Trend", data)
  .withColor(Color::rgb(212, 57, 57))
  .withPointSize(5.0)
  .withPointShape(Diamond)
.withLineStyle(Dashed)#Scatter Plot
Unconnected points with customizable shape, size, and fill color.
let data = [
  DataPoint::new(1.2, 2.1),
  DataPoint::new(2.3, 3.8),
  DataPoint::new(3.1, 5.2),
]

Series::scatter("Group X", data)
  .withColor(Color::rgb(0, 122, 184))
  .withPointSize(5.0)
  .withPointShape(Circle)
.withPointFill(Color::rgb(255, 0, 0))#Box Plot
Box-and-whisker plot with Q1/Q3 box, median line, whiskers to the furthest points within 1.5x IQR, and outlier markers.
let groups = [
  BoxGroup::new(0.0, "Control", [1.2, 2.1, 3.4, 2.8, 1.9, 2.5, 3.0, 2.3]),
  BoxGroup::new(1.0, "Treated", [0.8, 1.5, 2.9, 2.1, 1.3, 1.9, 2.4, 1.7]),
]

Series::boxplot("Expression", groups)
  .withColor(Color::rgb(0, 122, 184))
.withShowOutliers(true)#Mixed Charts
Series of different types can be combined in a single chart:
Chart::new()
  .series(Series::bar("Experiment", barData))
.series(Series::line("Trend", trendData).withLineStyle(Dashed))#Feature Matrix
Features below are per-series capabilities — attributes you set on individual Series objects via constructor modifiers.
| Feature | Bar | Line | Scatter | BoxPlot |
|---|---|---|---|---|
| Error Bars (Y) | ✓ | ✓ | ✓ | — |
| Point Shapes (5 types) | — | ✓ | ✓ | — |
| Line Styles (4 types) | — | ✓ | — | — |
| Custom Color | ✓ | ✓ | ✓ | ✓ |
| Point Fill Color | — | ✓ | ✓ | — |
| Point Size | — | ✓ | ✓ | — |
| Bar Stroke | ✓ | — | — | — |
| Outlier Display | — | — | — | ✓ |
| Dodged Groups | ✓ | — | — | ✓ |
#Builder API Reference
#Chart Builder
All methods return a new Chart (immutable builder pattern).
| Method | Default | Description |
|---|---|---|
| Chart::new() | Create a new chart (chart type is per-series) | |
| .title(text) | none | Chart title (centered at top) |
| .size(w, h) | 600 x 400 | Canvas dimensions in pixels |
| .width(w) | 600 | Canvas width only |
| .height(h) | 400 | Canvas height only |
| .xLabel(text) | none | X-axis label |
| .yLabel(text) | none | Y-axis label |
| .xTicks(positions, labels) | auto | X-axis tick positions and display labels |
| .yRange(min, max) | 0, 100 | Y-axis data range |
| .tickFontSize(size) | 11 | Tick label font size (both axes) |
| .labelFontSize(size) | 13 | Axis title font size (both axes) |
| .yGrid(show) | false | Y-axis grid lines |
| .xGrid(show) | false | X-axis grid lines |
| .barWidthRatio(ratio) | 0.7 | Bar/box width as fraction of band width (0.0-1.0) |
| .barGap(gap) | 0.0 | Gap between bars in a group, as fraction of bar width |
| .legend(show, position) | auto | Legend visibility and position |
| .legendFontSize(size) | 12 | Legend font size |
| .margin(top, right, bottom, left) | 40,20,40,50 | Margins around the plot area |
| .background(color) | white | Chart background color |
| .fontFamily(family) | sans-serif | Font family for all text elements |
| .series(s) | Add a single data series | |
| .addSeries(ss) | Add multiple series at once | |
| .toSvg() | Render chart to an SVG string (Result[String, String]) | |
| .save(filename) | Render and write SVG to file (Result[Unit, String]) | |
| .toOption() | Export the internal ChartOption (escape hatch) |
#Series Constructors
| Constructor | Description |
|---|---|
| Series::bar(name, data) | Bar chart series |
| Series::line(name, data) | Line chart series |
| Series::scatter(name, data) | Scatter plot series |
| Series::boxplot(name, groups) | Box plot series |
#Series Modifiers
| Method | Default | Applies To | Description |
|---|---|---|---|
| .withColor(color) | palette | all | Override series color |
| .withLineWidth(w) | 2.0 | line | Line stroke width |
| .withPointSize(s) | 4.0 | line, scatter | Data point marker radius |
| .withPointShape(shape) | Circle | line, scatter | Marker shape |
| .withLineStyle(style) | Solid | line | Line dash pattern |
| .withPointFill(color) | series color | line, scatter | Point fill color |
| .withBarStroke(color, w) | none | bar | Bar border color and width |
| .withErrorColor(color) | black | all with data | Error bar color (pass None to inherit series color) |
| .withErrorLineWidth(w) | 1.0 | all with data | Error bar line width |
| .withErrorCapWidth(w) | 6.0 | all with data | Error bar cap width |
| .withShowOutliers(show) | true | boxplot | Toggle outlier point display |
#Data Types
DataPoint::new(x, y)                         // Simple (x, y) point
DataPoint::withErrY(x, y, err)               // Symmetric error bar: y ± err
DataPoint::withAsymErrY(x, y, lo, hi)        // Asymmetric error bar: +hi, -lo

BoxGroup::new(x, label, values) // Raw data for box plot#Enums
PointShape: Circle | Square | Triangle | Diamond | Cross
LineStyle: Solid | Dashed | Dotted | DashDot
Position: TopLeft | TopCenter | TopRight | BottomLeft | BottomCenter | BottomRight | Left | Right
#Color
Color::rgb(r, g, b)       // Opaque color (alpha = 255)
Color::rgba(r, g, b, a)   // Color with alpha (0-255)
The default palette is a 6-color colorblind-friendly sequence: blue, orange, green, red, purple, brown. Override per-series with .withColor().
#Axis Configuration
AxisOption::defaultX()     // Default X axis (auto-infer ticks from data)
AxisOption::linearY() // Default linear Y axis [0, 100]#Static API
render(opt : ChartOption) -> Result[String, String]     // Render a ChartOption to SVG
saveSvg(filename : String, svg : String) -> Result[Unit, String] // Write SVG string to file#Running Examples
The examples/ directory contains ready-to-run chart demos. Each example is a standalone MoonBit package that generates an SVG file you can open in any browser.
# Run individual examples
moon run examples/bar_chart        # Grouped bar chart with error bars → bar_chart.svg
moon run examples/line_chart       # Multi-series line chart → line_chart.svg
moon run examples/scatter_chart    # Scatter plot → scatter_chart.svg
moon run examples/boxplot_chart    # Box plot → boxplot_chart.svg
moon run examples/mixed_chart      # Bar + line mixed chart → mixed_chart.svg
Each command produces an SVG file in the current directory. Open the generated .svg file in your browser to view the chart.
Tip: All examples use Chart::new()...save("output.svg") to write directly to disk. For programmatic use, replace .save(...) with .toSvg() to get the SVG string.
#Visualization
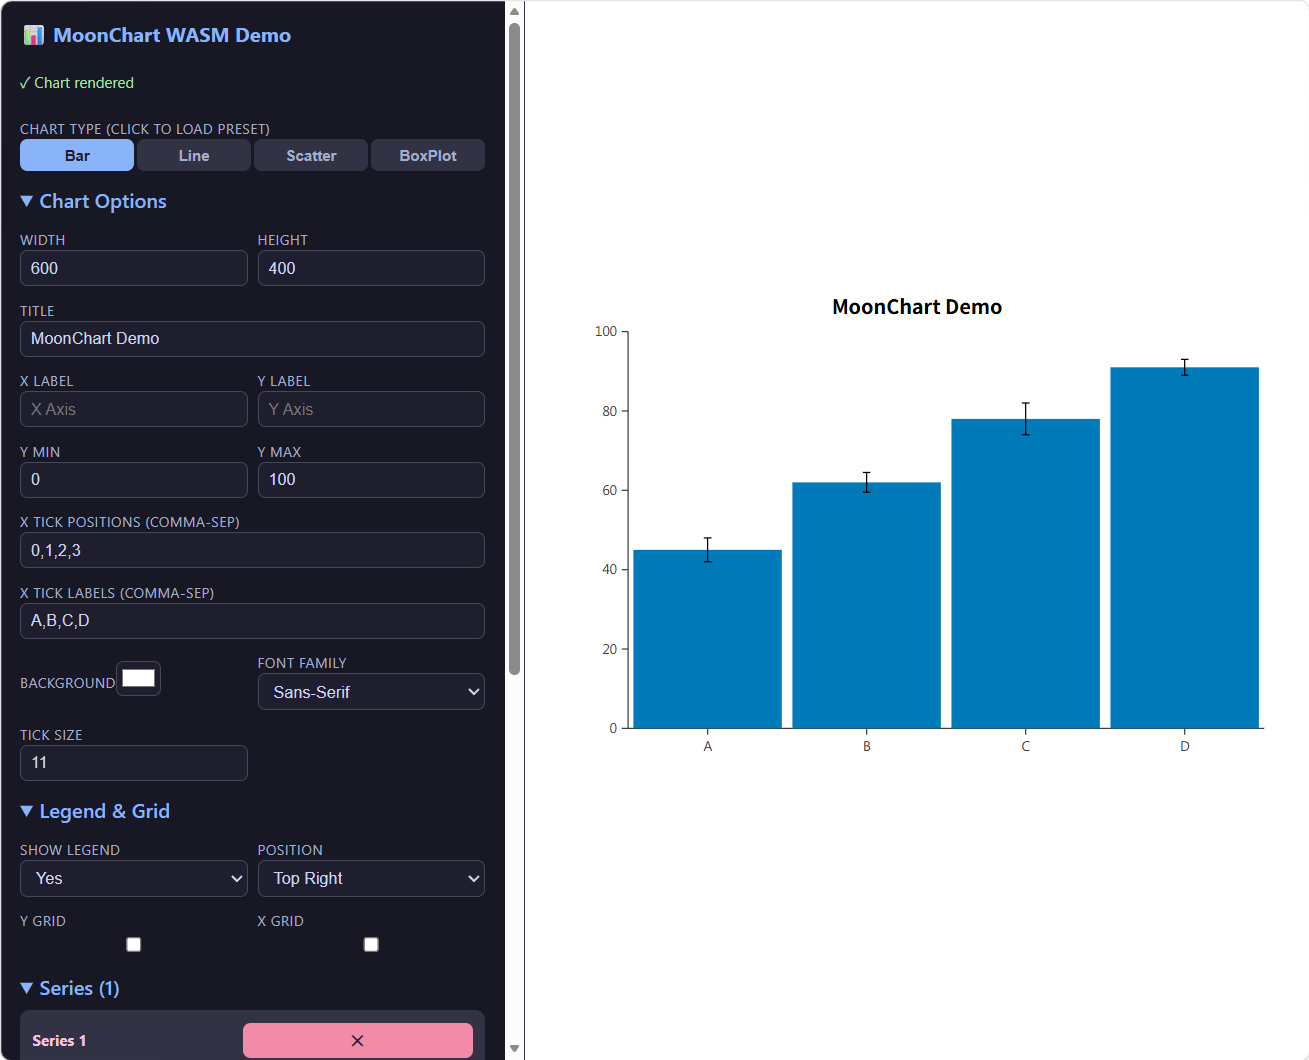
In the demo/ directory, you can launch a simple chart editor that includes all features of this project and lets you visualize the final SVG image in real time by adjusting parameters.
Run the editor with the following command:
# Start a local HTTP server in the demo directory
cd demo
python -m http.server 8080
Then open http://localhost:8080 in your browser.
#WASM Usage
MoonChart can be compiled to WASM-GC for browser use. A dedicated WASM module is provided at wasm/wasm_api.mbt that exposes a single function:
pub fn render_chart(config_json : String) -> StringIt accepts a JSON configuration string and returns an SVG string. The WASM package is configured in wasm/moon.pkg.json with render_chart as the exported function.
Build for WASM:
moon build --target wasm-gcThis enables rendering MoonChart graphics directly in the browser from JavaScript, with all chart types, error bars, and styling options available via a JSON-based API.
#License
Apache 2.0
#Scale
pub trait Scale {
  fn map(Self, Double) -> Double
  fn ticks(Self, Int) -> Array[(Double, String)]
  fn plotSize(Self) -> Double
}
Trait for coordinate mapping from data space to pixel space.
#AxisOption
Configuration for a single axis (X or Y).
#AxisOption::defaultX
Create a default X axis (auto-infer ticks from data).
#AxisOption::linearY
Create a default linear Y axis [0, 100].
#AxisOption::withLabel
Set the axis label for this axis. Returns a new AxisOption.
#BoxGroup
#BoxStats
pub(all) struct BoxStats {
  min : Double
  q1 : Double
  median : Double
  q3 : Double
  max : Double
  iqr : Double
  lowerFence : Double
  upperFence : Double
  whiskerLow : Double
  whiskerHigh : Double
  outliers : Array[Double]
}
Statistics for a single box plot: min, Q1, median, Q3, max, IQR, fences, whiskers, and outliers.
#CategoryScale
Category/band scale: maps data x-values to band centers.
Supports explicit tick positions/labels and auto-inference.
#CategoryScale::bandCenter
Find the band center pixel for a data value.
Uses data-coordinate mapping to correctly handle non-uniform tick spacing.
#CategoryScale::count
Number of tick positions.
#CategoryScale::dataRange
Get min/max data range for the category scale.
#CategoryScale::getBandWidth
Get the band width (for bar width calculations).
#CategoryScale::label
Get tick label by index.
#CategoryScale::map
Map a data value to pixel using linear interpolation.
#CategoryScale::new
fn CategoryScale::new(tickPositions : Array[Double], tickLabels : Array[String], plotPixels : Double) -> CategoryScaleCreate a category scale from tick positions and labels.
When positions is empty, auto-inference is used (handled by layout).
#CategoryScale::plotSize
Return the plot size (width or height) in pixels.
#CategoryScale::position
Get tick position by index.
#CategoryScale::ticks
Generate tick marks at data-coordinate positions.
Tick positions are mapped via data-coordinate interpolation (not index-based).
#CategoryScale::unmap
Inverse map: pixel position to data value.
#Chart
Chart builder wraps a ChartOption and provides chainable methods.
#Chart::addSeries
Add multiple series at once.
#Chart::background
Set chart background color.
#Chart::bar
Deprecated: use Chart::new() instead. Chart type is per-series.
#Chart::barGap
Set bar gap ratio (0.0~1.0). Gap between bars in a group, as fraction of bar width. Default: 0.0.
#Chart::barWidthRatio
Set bar width ratio (0.0~1.0). Fraction of band width occupied by bars. Default: 0.7.
#Chart::fontFamily
Set font family for all text elements.
#Chart::labelFontSize
Set axis label (title) font size for both axes.
#Chart::legend
Set legend visibility and position.
#Chart::legendFontSize
Set legend font size.
#Chart::line
Deprecated: use Chart::new() instead. Chart type is per-series.
#Chart::margin
Set chart margins.
#Chart::new
Create a new chart. Chart type is determined per-series via Series::bar/line/scatter.
#Chart::save
Render the chart and save to a file (native target only).
Returns Ok(()) on success, Err(message) on failure.
#Chart::scatter
Deprecated: use Chart::new() instead. Chart type is per-series.
#Chart::size
Set chart width and height.
#Chart::tickFontSize
Set tick font size for both axes.
#Chart::toOption
Export the internal ChartOption (escape hatch for advanced users).
#Chart::toSvg
Render the chart to an SVG string.
Returns Result with the SVG string on success, error message on failure.
#Chart::xGrid
Enable X-axis grid lines with default color.
#Chart::xTicks
Set X axis tick positions and labels.
positions — data coordinate for each tick.
labels — display label for each tick (must match positions length).
When positions is empty, ticks are auto-inferred from data.
#Chart::yGrid
Enable Y-axis grid lines with default color.
#ChartOption
pub struct ChartOption {
  width : Double
  height : Double
  margin : Margin
  background : Color
  title : String?
  titleFont : Font
  xAxis : AxisOption
  yAxis : AxisOption
  series : Array[Series]
  legend : Bool
  legendPosition : Position
  legendFontSize : Double
  barWidthRatio : Double
  barGap : Double
  fontFamily : String
}
Complete chart configuration.
#ChartOption::new
Create a default ChartOption with given axes and series.
#ChartType
pub enum ChartType {
  Bar
  Line
  Scatter
  BoxPlot
}
The type of chart to render for a series.
#Color
pub(all) struct Color {
  r : Int
  g : Int
  b : Int
  a : Int
}
An RGBA color with components in 0-255 range.
#Color::rgb
Construct an opaque color from RGB (alpha = 255).
#Color::rgba
Construct a color with explicit alpha.
#Color::toHex
Convert color to hex string like "#FF0000".
#DataPoint
pub struct DataPoint {
  x : Double
  y : Double
  error_y : ErrorValue?
  error_x : ErrorValue?
  label : String?
}
A single data point in a series.
#DataPoint::new
Create a simple (x, y) data point with no extras.
#DataPoint::withAsymErrY
Create a data point with an asymmetric Y error bar.
#ErrorValue
pub(all) enum ErrorValue {
  Symmetric(Double)
  Asymmetric(Double, Double)
}
Represents the error/uncertainty of a data point.
#ErrorValue::hi
Get the upper bound of an error value relative to the data point.
#ErrorValue::lo
Get the lower bound of an error value relative to the data point.
#Font
Font configuration for text elements.
#Font::svgAttrs
Build full SVG text style attributes string.
#Layout
pub struct Layout {
  canvas : Rect
  plot : Rect
  xScale : CategoryScale
  yScale : LinearScale
  dodgeOffsets : Array[Double]
  barWidth : Double
}
Layout result: everything renderers need.
#LinearScale
pub struct LinearScale {
  min : Double
  max : Double
  plotPixels : Double
}
Linear numeric scale mapping [min, max] to [0, plotPixels].
#LinearScale::map
Map a data value to pixel position (linear interpolation).
#LinearScale::new
Create a linear scale.
#LinearScale::plotSize
Return the plot size (width or height) in pixels.
#LinearScale::ticks
Generate nice tick positions using the 1/2/5×10^n algorithm.
#LinearScale::unmap
Inverse map: pixel position to data value.
#LogScale
pub struct LogScale {
  base : Double
  min : Double
  max : Double
  plotPixels : Double
}
Logarithmic scale mapping [min, max] to [0, plotPixels].
#LogScale::map
Map data value to pixel using log mapping.
#LogScale::new
Create a logarithmic scale.
#LogScale::plotSize
Return the plot size (width or height) in pixels.
#Margin
pub(all) struct Margin {
  top : Double
  right : Double
  bottom : Double
  left : Double
}#PointShape
pub(all) enum PointShape {
  Circle
  Square
  Triangle
  Diamond
  Cross
}
Shape of data point markers.
#Position
pub(all) enum Position {
  TopLeft
  TopCenter
  TopRight
  BottomLeft
  BottomCenter
  BottomRight
  Left
  Right
}
Position of the legend within the chart.
#Rect
pub struct Rect {
  x : Double
  y : Double
  w : Double
  h : Double
}
A rectangle in pixel space.
#Series
pub struct Series {
  name : String
  chartType : ChartType
  data : Array[DataPoint]
  color : Color?
  lineWidth : Double
  pointSize : Double
  pointShape : PointShape
  lineStyle : LineStyle
  pointFill : Color?
  barStroke : Color?
  barStrokeWidth : Double
  errorColor : Color?
  errorLineWidth : Double
  errorCapWidth : Double
  boxGroups : Array[BoxGroup]
  showOutliers : Bool
}
A data series: one group of data points with a chart type and style.
#Series::bar
Create a bar chart series.
#Series::boxplot
Create a box plot series.
#Series::line
Create a line chart series.
#Series::scatter
Create a scatter chart series.
#Series::withBarStroke
Set bar stroke color and width.
#Series::withColor
Set a custom color for this series.
#Series::withErrorCapWidth
Set error bar cap width.
#Series::withErrorColor
Set error bar color (None to inherit series color).
#Series::withErrorLineWidth
Set error bar line width.
#Series::withLineStyle
Set line style (dashed, dotted, etc.).
#Series::withLineWidth
Set line width for this series.
#Series::withPointFill
Set point fill color.
#Series::withPointShape
Set point shape for this series.
#Series::withPointSize
Set point size for this series.
#DEFAULT_ERROR_CAP_WIDTH
let DEFAULT_ERROR_CAP_WIDTH : DoubleDefault error bar cap width (horizontal crossbar).
#DEFAULT_POINT_SIZE
let DEFAULT_POINT_SIZE : DoubleDefault point marker radius for scatter/line charts.
#circle
fn circle(cx~ : Double, cy~ : Double, r~ : Double, fill~ : String, stroke~ : String, strokeWidth~ : Double) -> StringGenerate an SVG circle element.
#computeBoxStats
Compute box plot statistics (five-number summary, IQR, fences, whiskers, outliers) from an array of values.
#computeLayout
Compute the layout from a ChartOption.
Returns Result: Ok(Layout) on success, Err(message) on failure.
#formatPoints
Format a sequence of (x, y) points into a polyline points string.
#line
fn line(x1~ : Double, y1~ : Double, x2~ : Double, y2~ : Double, stroke~ : String, strokeWidth~ : Double) -> StringGenerate an SVG line element.
#polyline
fn polyline(points~ : String, stroke~ : String, strokeWidth~ : Double, fill~ : String) -> StringGenerate an SVG polyline element for line charts.
#rect
fn rect(x~ : Double, y~ : Double, w~ : Double, h~ : Double, fill~ : String, stroke~ : String, strokeWidth~ : Double) -> StringGenerate an SVG rect element.
#render
Render a ChartOption directly to SVG (static entry point).
#renderBars
Render all bar series into SVG strings. Parameters: layout - chart layout, opt - chart options, seriesIndex - index of the series to render.
#renderBoxplot
Render a box plot series (Q1/Q3 box, median line, whiskers with caps, and outliers) into SVG. Parameters: layout - chart layout config, opt - full chart options, seriesIndex - index of the series to render.
#renderErrorBars
Render error stems and caps for a series, matching bar, box, line, or scatter chart positions. Parameters: layout, chart options, and the series index within the options.
#renderLegend
Render the chart legend.
#renderLine
Render a line series into SVG given layout, chart options, and series index.
#renderScatter
Render a scatter series into SVG from the given layout, chart options, and series index.
#renderTitle
Render the chart title (centered at top). opt provides the title text and chart dimensions.
#renderXAxis
Render the X-axis (bottom of plot area). layout provides plot and scale geometry; opt provides axis styling.
#renderYAxis
Render the Y-axis (left side of plot area). layout provides plot and scale geometry; opt provides axis styling.
#rotatedText
Generate a rotated SVG text element (for Y axis labels).
#saveSvg
fn saveSvg(filename : String, svg : String) -> Result[Unit, String]Save an SVG string to a file in the current directory.
Uses @fs.write_string_to_file from moonbitlang/x.
Returns Ok(()) on success, Err(message) on failure.
#seriesColor
Get the color for a series by its index (0-based).
#svgOpen
fn svgOpen(width~ : Double, height~ : Double, bg~ : String) -> StringGenerate the SVG document opening.
#text
Generate an SVG text element.
A statistical chart SVG generation library for MoonBit. Supports bar charts, line charts, scatter plots with error bars and multi-series rendering.
chartplotsvgvisualizationstatisticsscience

 0.1.2
0.1.2 Apache-2.0
 Updated last month
 29 downloads
Dependencies
- moonbitlang/x0.4.44
- JunJunTnT/moonchart0.1.1